Belmont, CA Spring 2026 Single Family Home Market Review
Belmont Single Family Home Spring 2026: Tight, Fast, and Unforgiving to the Unprepared.
The Bottom Line
With only 30 homes available in March, just 1.7 months of supply, and 77% of homes selling above asking price — up from 70% last year — Belmont's single-family market didn't soften this spring. It sharpened. By May, the median list price hit $2.09M at $1,137 per square foot, with homes averaging 32 days on market.
Inventory rose roughly 15% year-over-year. Yet homes are going pending in just 9 days and drawing roughly 15 offers each. More choices — same ferocity. The numbers tell a clear story: this is a seller's market operating at high compression, and buyers who don't understand that will keep losing.
Year-Over-Year: What Actually Changed
Comparing Spring 2026 single-family sales data to last spring, the average price per square foot increased 6.48% — from $1,280 to $1,363. The average home sales price, however, decreased by $131,473. Homes sold slightly quicker, closing 3 days faster on average.
That apparent contradiction — rising price-per-square-foot alongside a declining average sale price — is driven almost entirely by the luxury tier. The top 10% of the market saw a 38.5% decline, with a $265K drop on the low end of that bracket and an $860K dip on the high end. Strip that out, and the core market is performing exactly as you'd expect: strong, steady, and unforgiving to properties that don't show well.
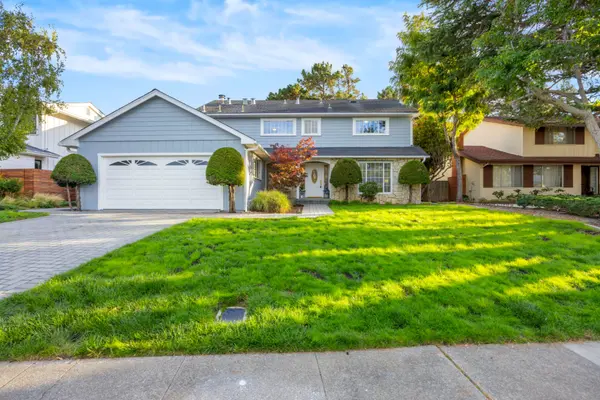
The core inventory consists mostly of 3-bedroom, 2-bath homes — the middle 74.3% of the market — ranging from $1.9M to $3.2M. That segment held steady with only a slight softening at the higher end.
What Buyers Need to Internalize
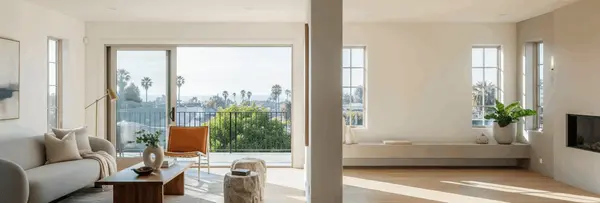
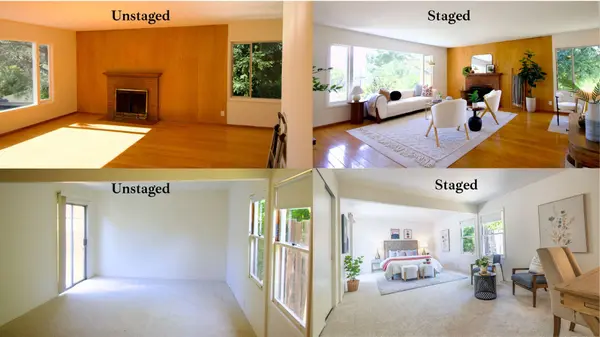
At these price points, today's buyers aren't writing six-figure renovation budgets on top of a $2M purchase. Turnkey wins, period. Move-in-ready, pristine properties command top dollar — and command them quickly. Fixers face a far tougher crowd.
That said, there is one exception worth knowing. If a fixer does enter the market, it better sit on a flat lot with a generous backyard — the only scenario where contractors can realistically expand square footage or build an ADU without a hillside battle. Belmont's topography makes flat-lot fixer-uppers genuinely rare. When one surfaces, it draws a premium that most fixers simply cannot match.
Everything else gets a discount it can't overcome. If you own a fixer in Belmont, be prepared to price it low and have a bidding strategy in place before day one.
Spring 2026 Market Snapshot
- Values Up: The average price per square foot climbed 6.48%, jumping from $1,280 to $1,363 year over year.
- Pace Up: Homes are moving faster, closing an average of 3 days quicker than last spring — going pending in just 9 days and drawing roughly 15 offers each.
- Core Market Stability: 3-bed, 2-bath homes make up 74.3% of sales, holding steady between $1.9M and $3.2M.
- Price Adjustment: The overall average sale price dipped $131,473, driven mostly by a 38.5% slowdown in the luxury tier (top 10%), with a $265K drop on the low end and an $860K dip on the high end.
- Turnkey Premium: Buyers are willing to pay top dollar for pristine, move-in-ready properties. Fixers face a tougher crowd — unless they sit on a flat, spacious lot with ADU potential.
Thinking about buying or selling in Belmont? Let's talk strategy before wirting an offer of putting your home on the market
Categories
Recent Posts